Li diffusion in sulfide solid electrolyte
Theme Overview
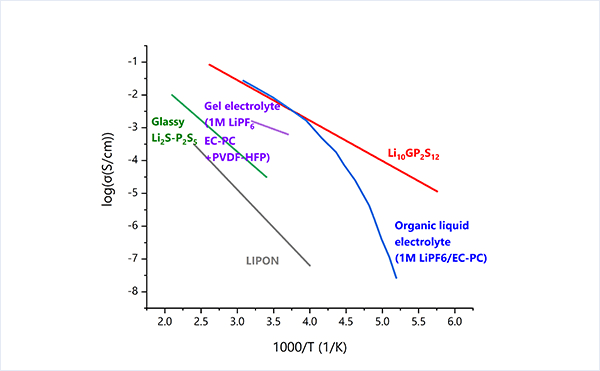
Ion-conducting solid electrolytes have been known for a long time, but have undergone remarkable development in the past decade or so. In particular, sulfide-based solid electrolytes have dramatically improved their ionic conductivity and are expected to be used in all-solid-state lithium-ion batteries.
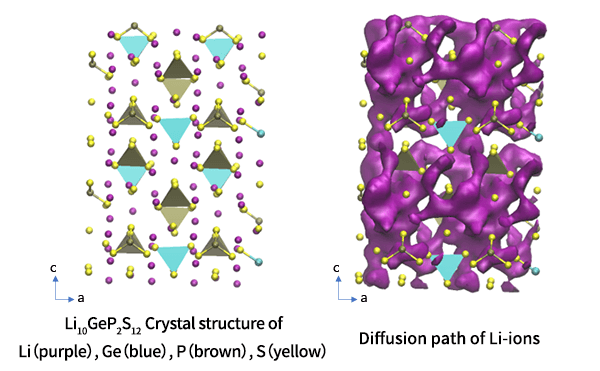
Li10GeP2S12 (LGPS) belongs to the category that shows the highest Li-ion conductivity among the existing sulfide solid electrolytes, and its unique crystal structure contributes to the high performance.
In this section, we compute the diffusion coefficient of Li-ion in LGPS by molecular dynamics calculation using Matlantis.
The sample script is uploaded on github:
Calculation Models and Methods
In this section, we will optimize the crystal structure of LGPS and calculate the diffusion coefficient of Li.
The crystal structure of LGPS can be obtained from the original paper [1] or Materials Project [2]. Based on the obtained structure, we will analyze the behavior of lithium ion by molecular dynamics after confirming the reproducibility by structural optimization.
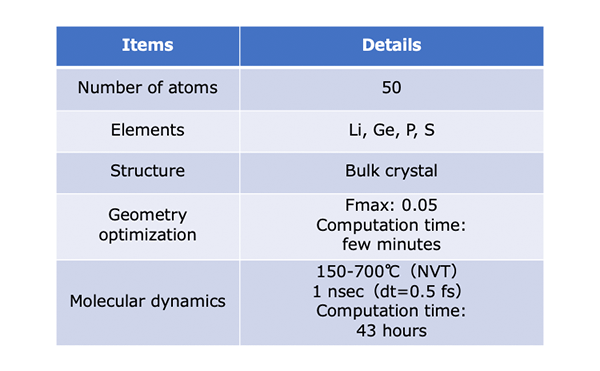
We adopt NVT ensemble using Langevin dynamics simulation.
Results and Discussion
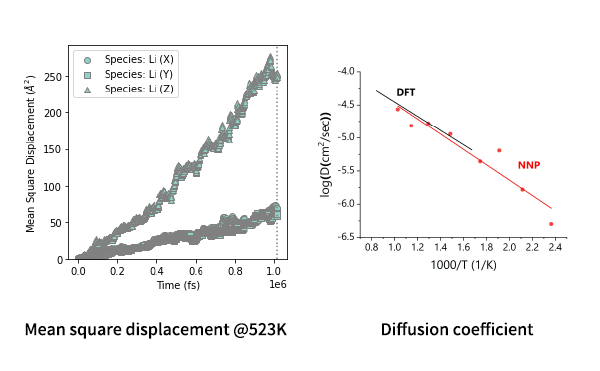
It is known that in LGPS, diffusion in the c-axis (=z direction) is most prominent and limited in the perpendicular directions. The MSD plot clearly shows such feature. The diffusion coefficients can be computed from the MSD and shown in the Arrhenius plot.
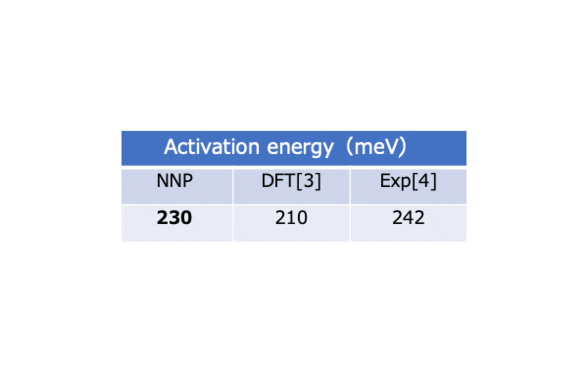
The activation energy is found to be in good agreement with the DFT values as well as the experimental value reported in the literature [3-4].
This type of MD simulations are often performed at very high temperatures when a conventional DFT is used. However, it can be performed at much lower temperatures using Matlantis because of the low computational cost, and the results can be more readily compared with the experimental data.
Computational Details
References
[1] N. Kamaya, et. al., Nature Mater 10, 682–686 (2011). https://www.nature.com/articles/nmat3066 [2] https://materialsproject.org/ [3] Mo et al. Chem. Mater. (2012) 24, 15-17 https://pubs.acs.org/doi/10.1021/cm203303y [4] Y. Kato, et. al. Nat. Energy 1, 16030. https://www.nature.com/articles/nenergy201630tag
Published: July 1, 2021
-


 URL
URL
Copied
what's new
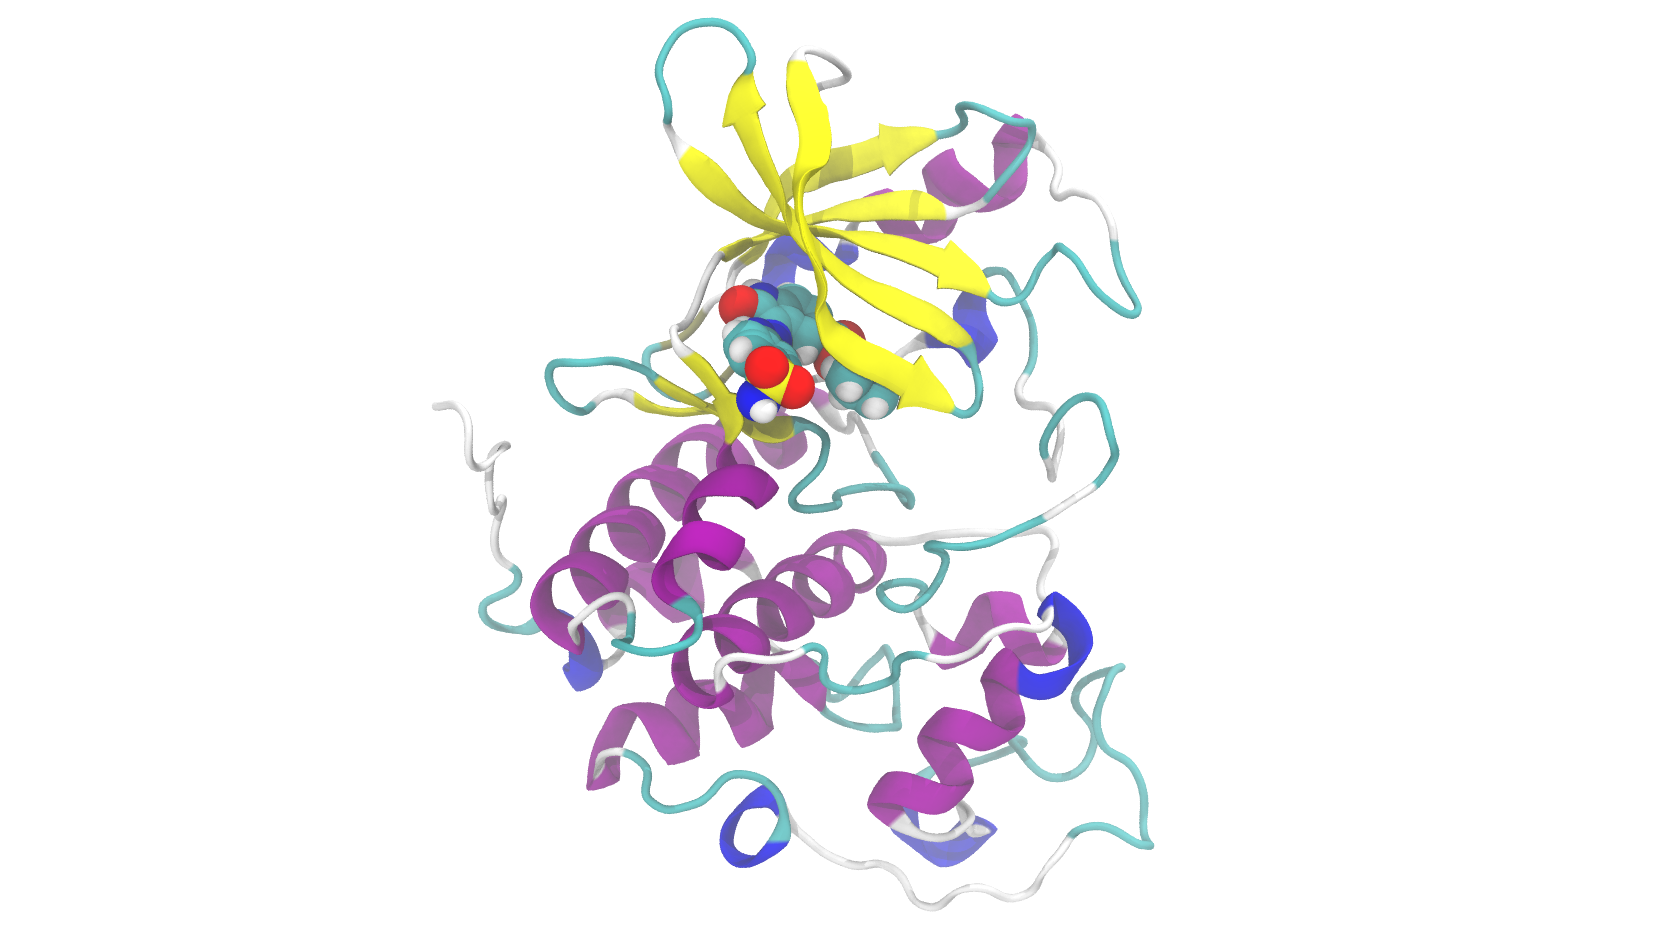
High-Accuracy, High-Speed Binding Energy Evaluation of Cyclin-Dependent Kinase 2 Inhibitors
バイオ・医薬
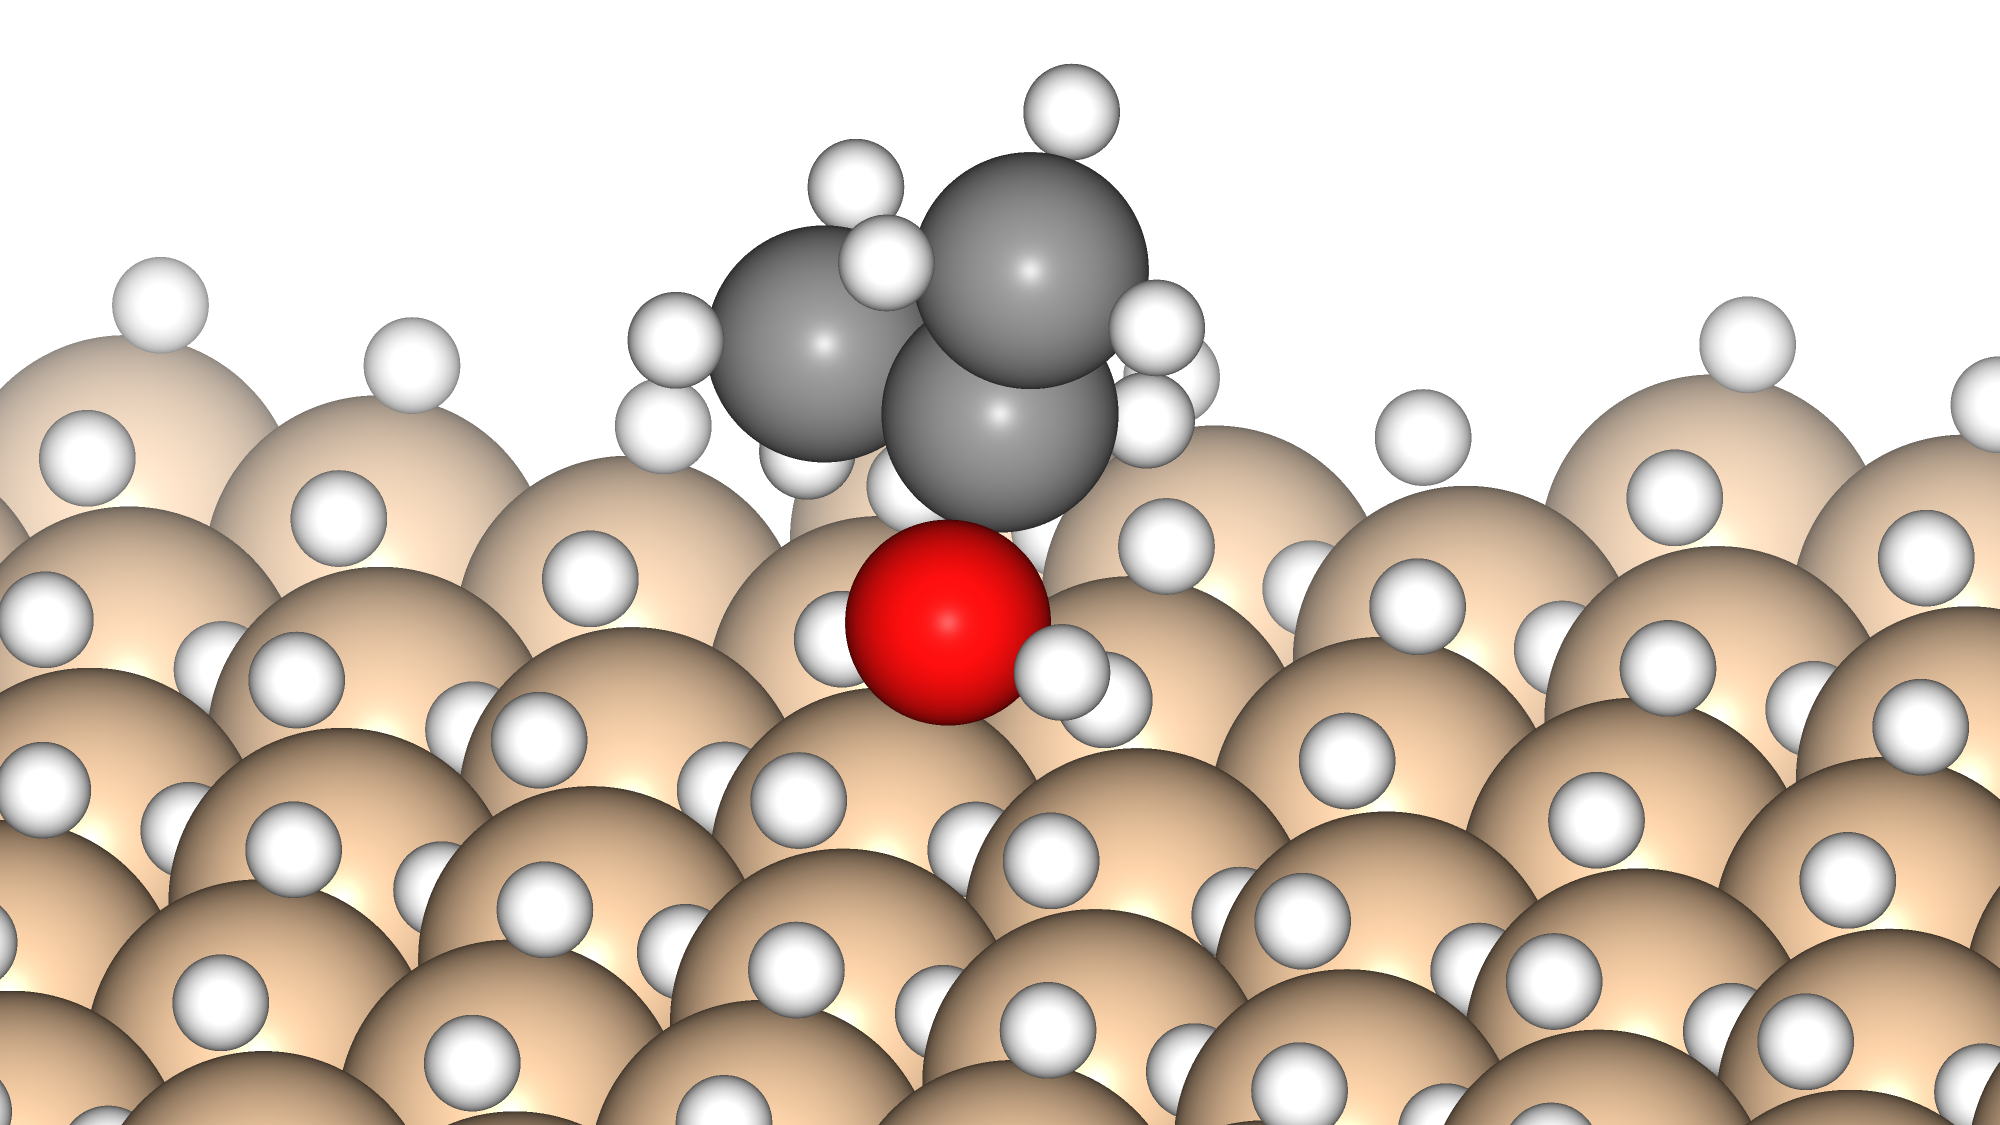
Data-Driven Method for Discovering Low Adsorption Energy Molecules on Si Surfaces
ScreeningMaterials InformaticsSemiconductors
Calculation and Verification of Methanol Synthesis Catalysts
Methanol synthesis catalystsLarge-scale screening
Direct derivation of atomic displacement parameters using NNP-MD
Atomic Displacement ParametersThermoelectric Materials
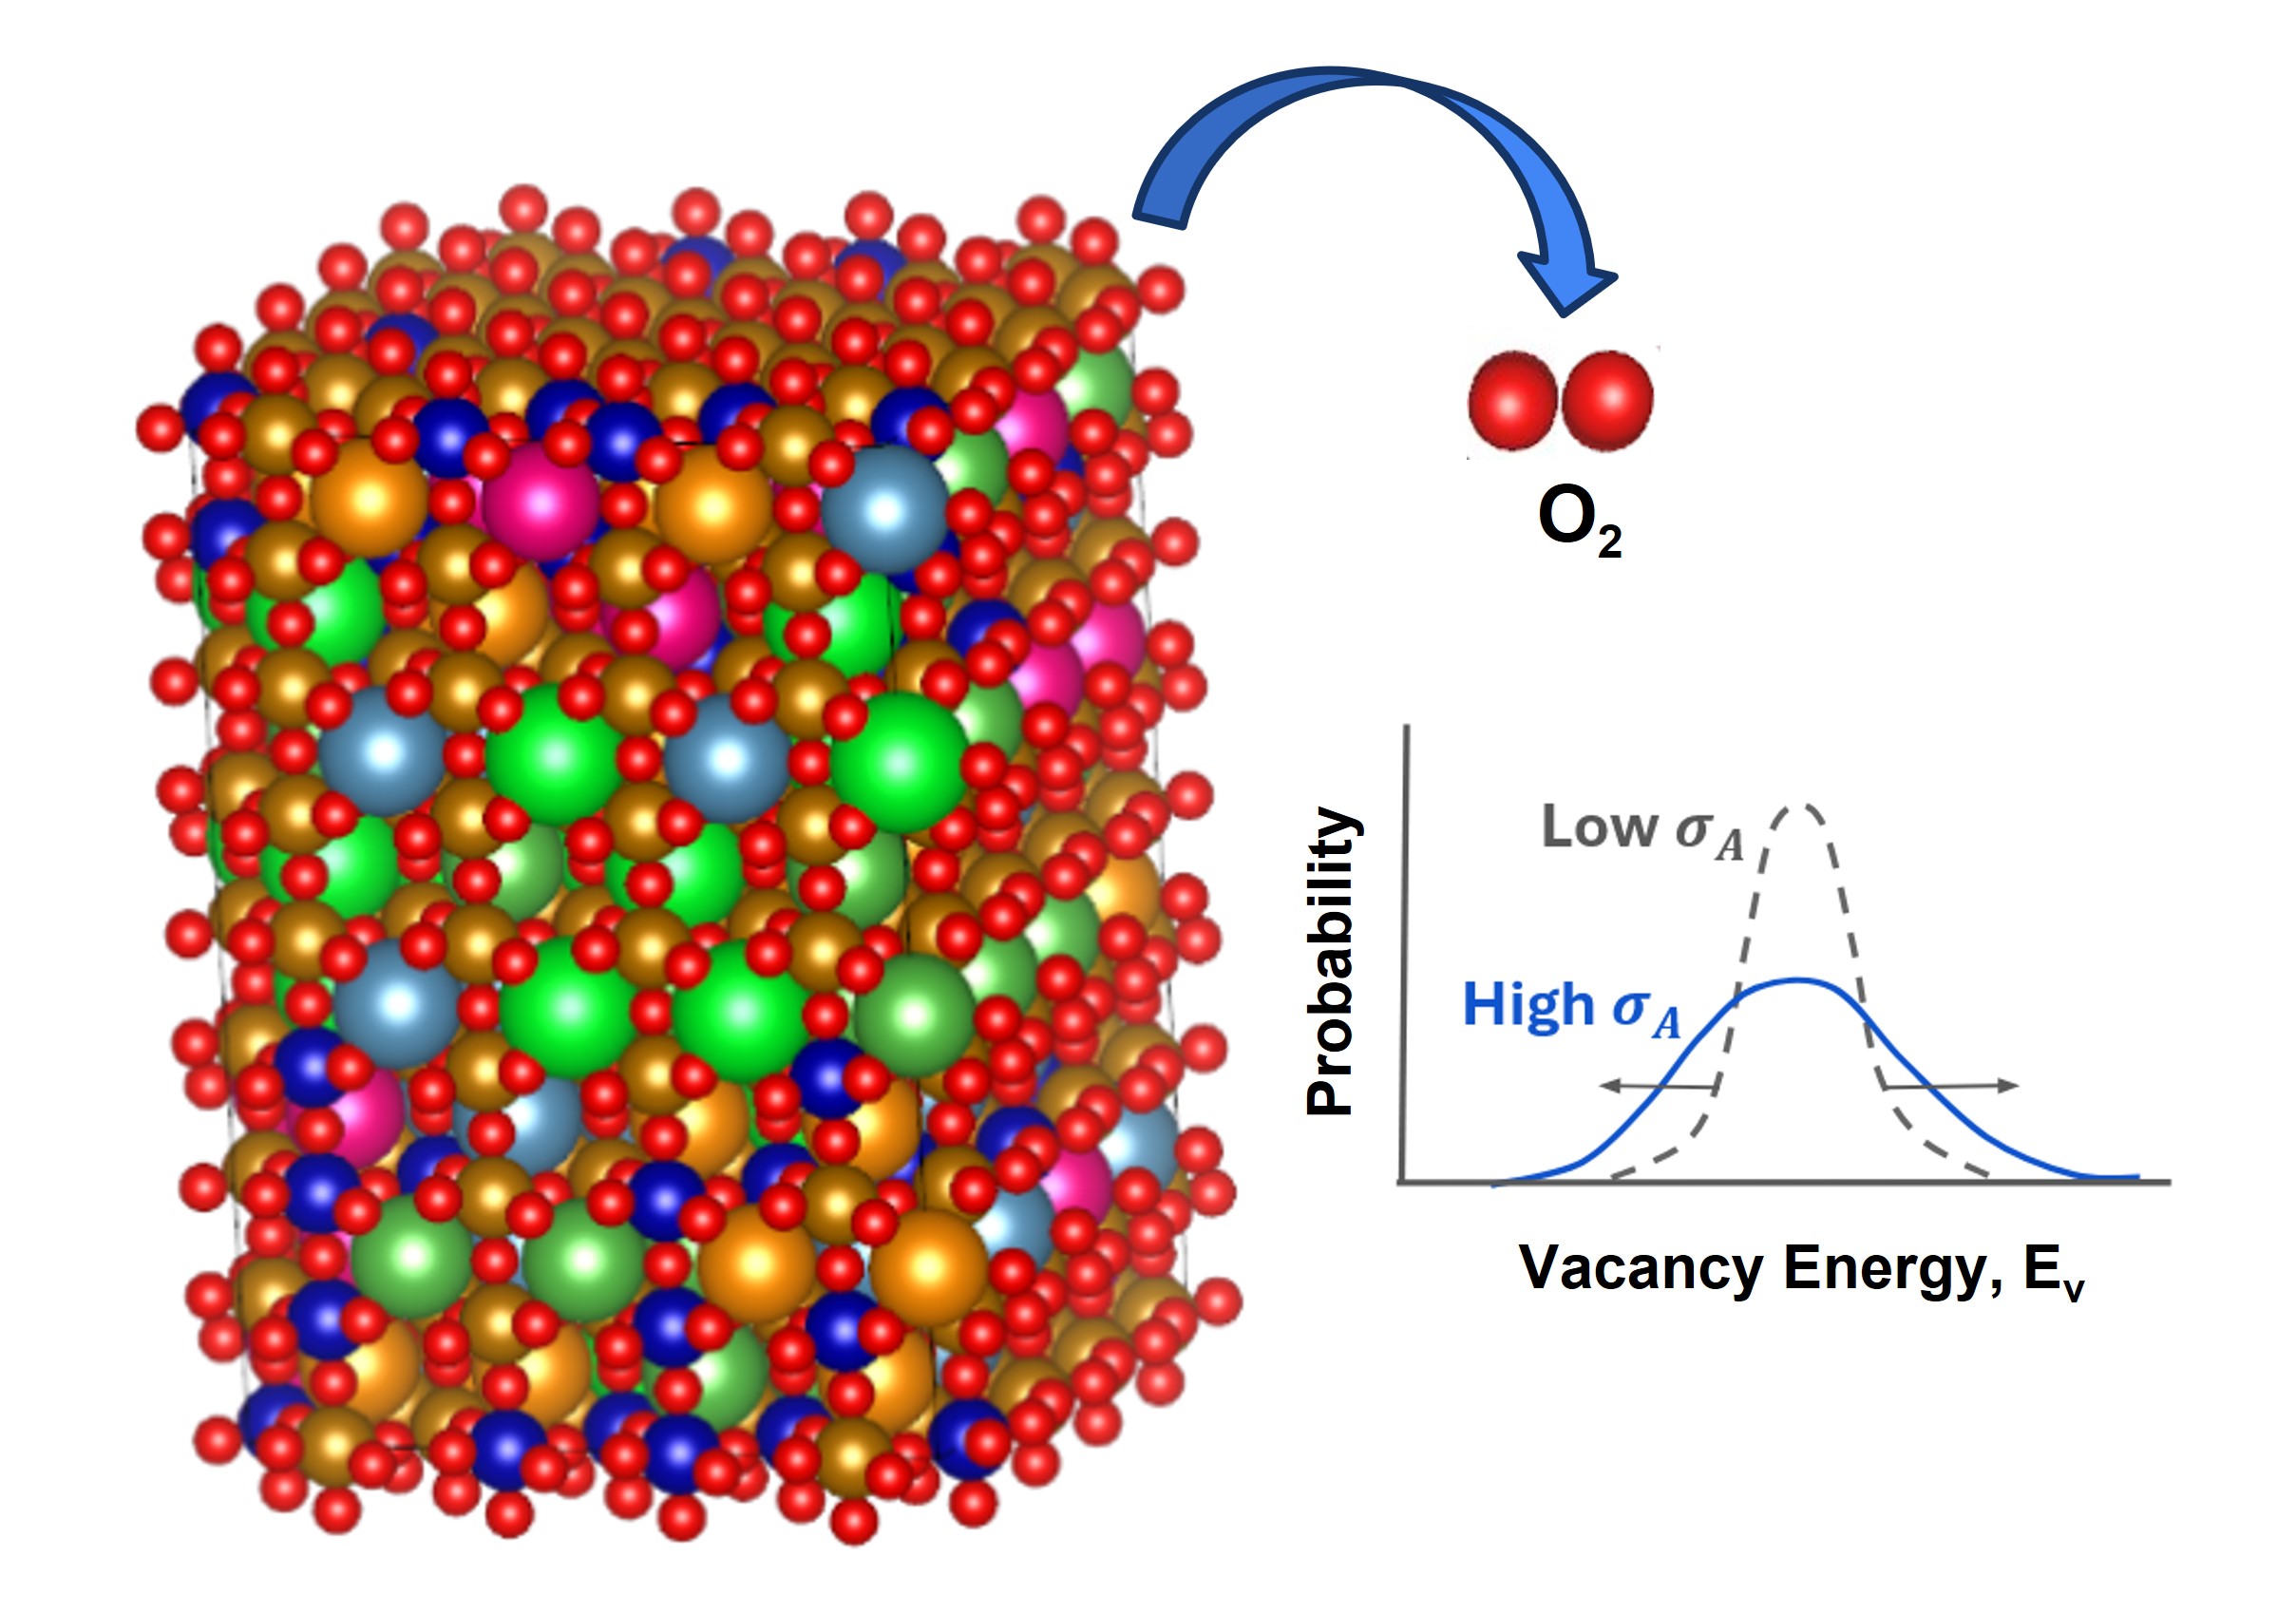
A Statistical Understanding of Oxygen Vacancies in High-Entropy Perovskite Oxides
CeramicsHigh Entropy MaterialsElectrolysis