Computational prediction of ternary phase diagram
Introduction
While there are a vast number of possible configurations for crystal structures, only energetically stable ones can exist in the real world.
Therefore, it is crucial to accurately evaluate the relative energy order of various crystal structures for computational materials discovery. Electronic structure calculations have been used in the past, but the computational cost makes it difficult to apply to large-scale screenings.
In this case study, to evaluate the accuracy of PFP, we drew phase diagrams with respect to composition ratios at 0 K using both PFP and Density Functional Theory (DFT).
Calculation Models and Methods
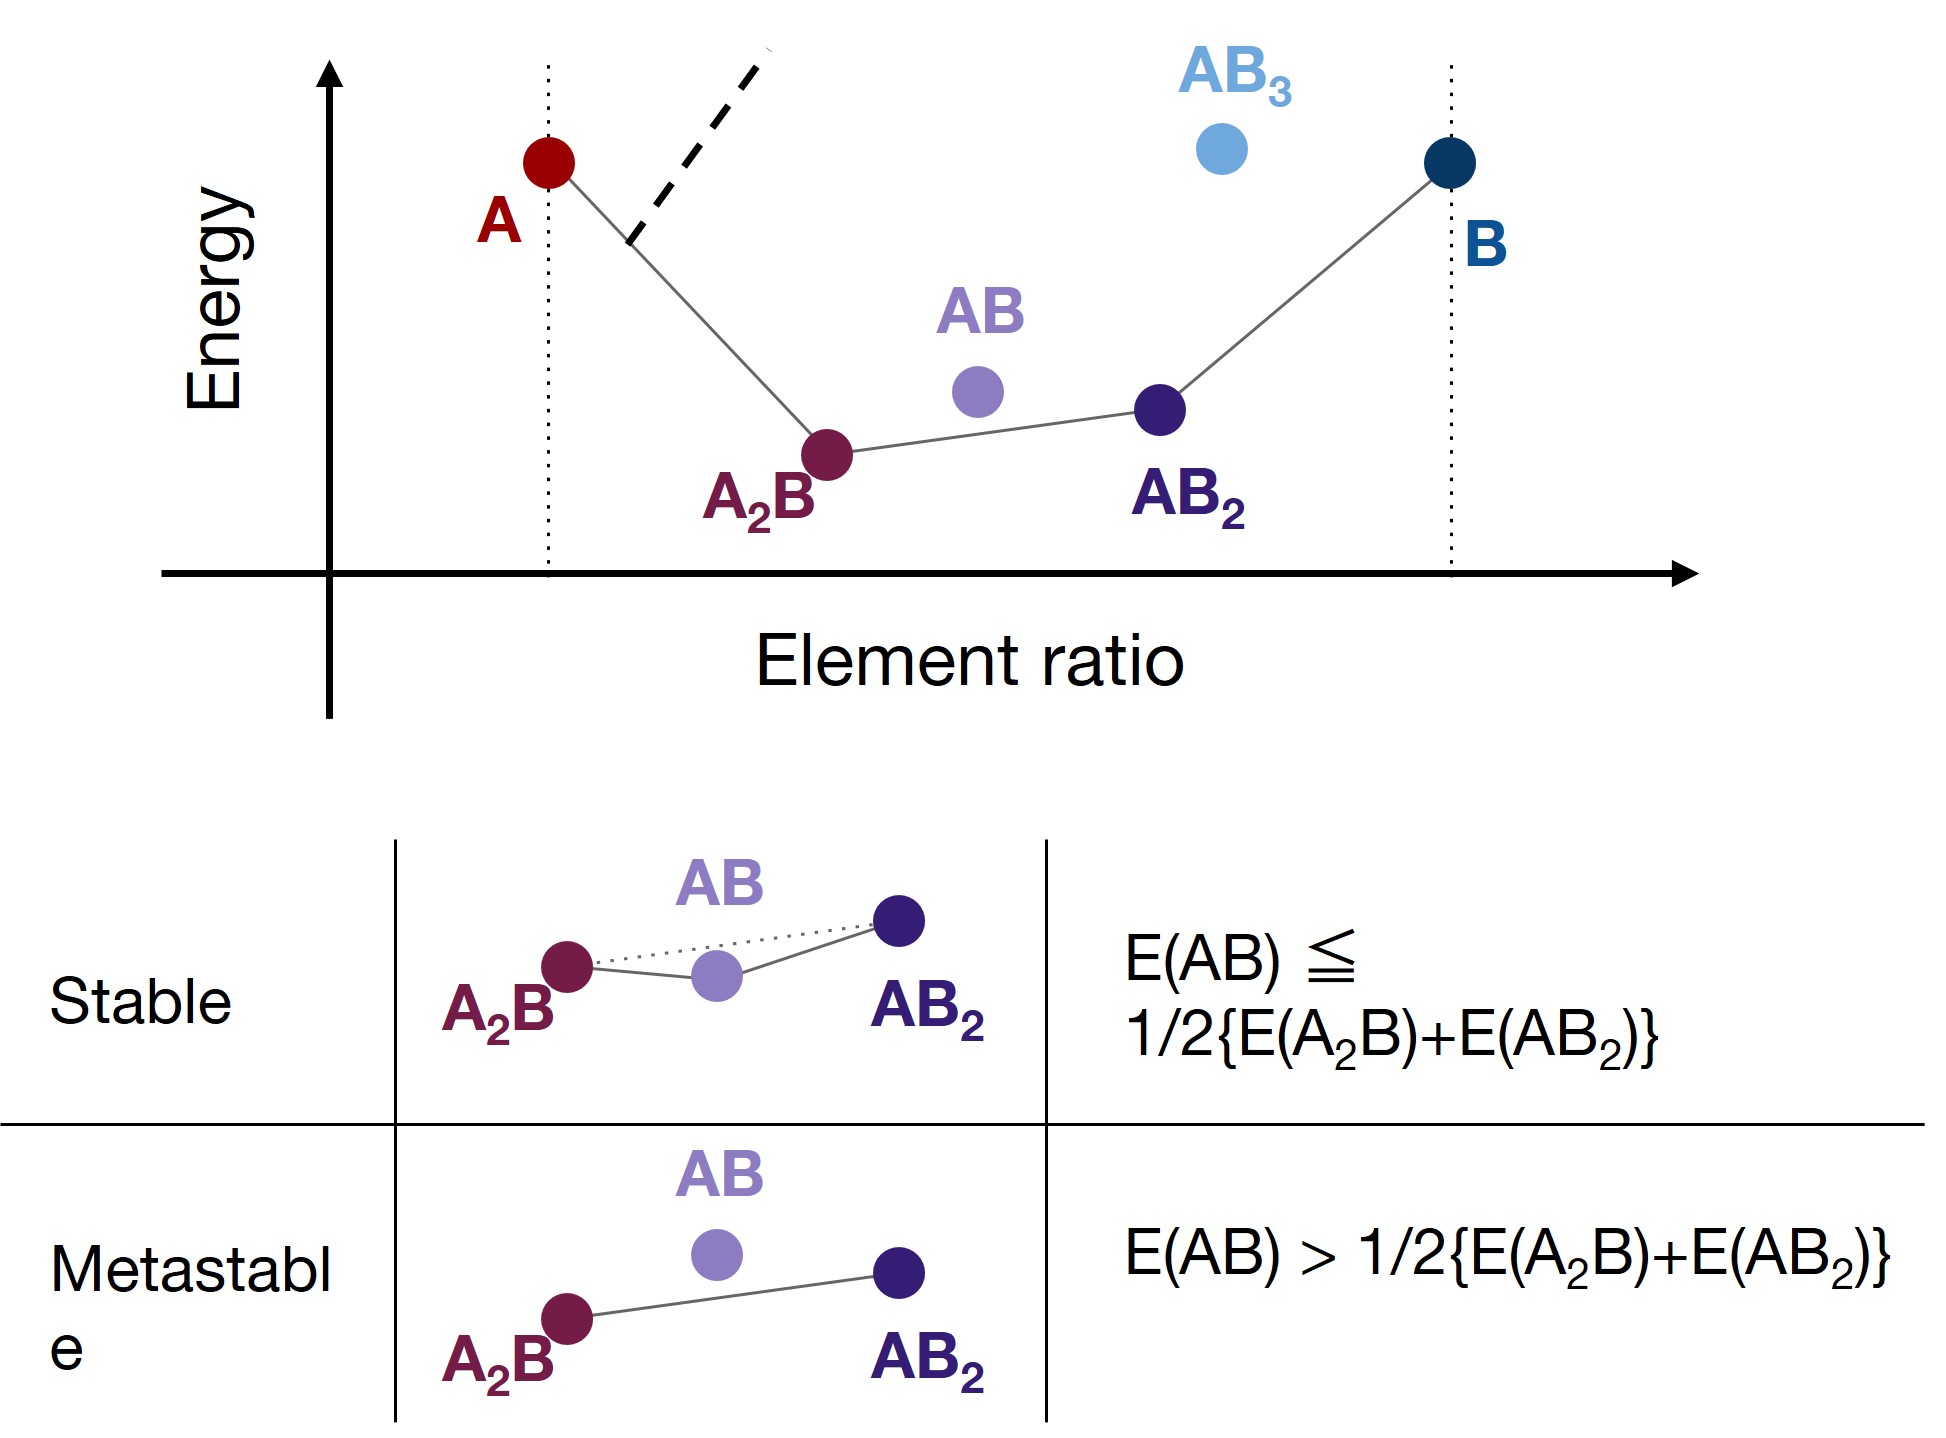
Phase diagrams can be obtained by calculating the formation energies of all candidate crystal structures and plotting them by composition ratio v.s. energy space.
The phase stability can be evaluated by constructing a convex hull connecting the lowest energy points. The points that make up the convex hull represent stable structures, while points located above the convex hull represent metastable structures. (Metastable structures are not energetically stable, and are decomposed to the stable structures on the convex hull.)
For ternary materials, the composition ratio has two degrees of freedom, which corresponds to a three-dimensional space. For more than three elements, the space becomes even higher-dimensional. In either case, stable and metastable structures can be distinguished by constructing the convex hull.
Results and Discussion
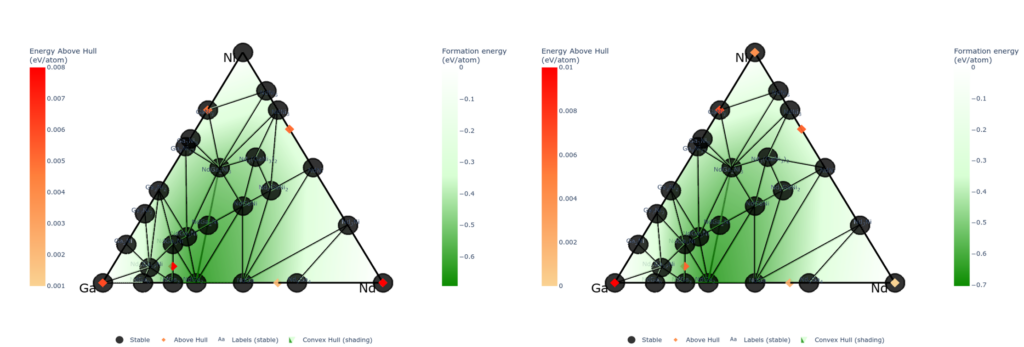
The upper figures show phase diagrams of the ternary Ni-Ga-Nd system calculated using PFP and DFT, respectively. The black points correspond to structures on the convex hull. It clearly shows that PFP well reproduce the DFT phase diagrams.
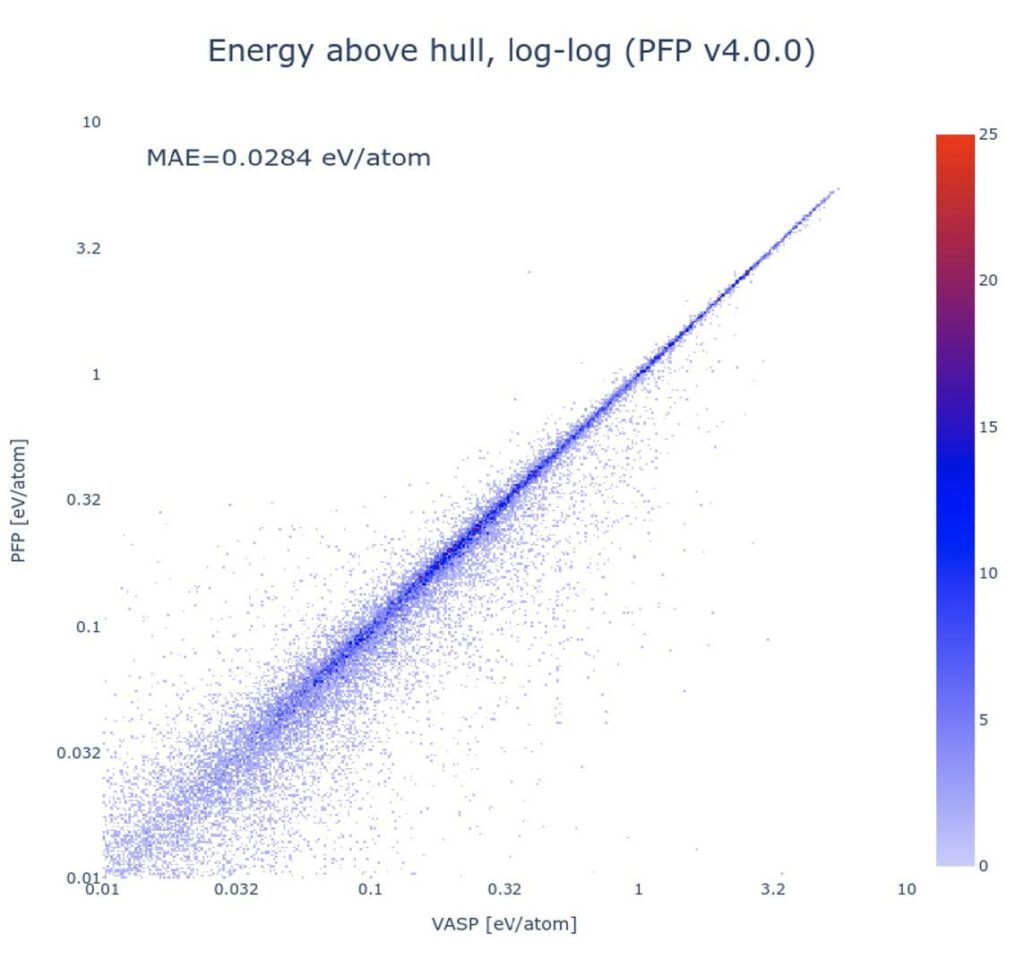
The error of PFP in the calculations of phase diagrams are evaluated for all possible combinations of elements up to ternary systems. The lower figure show the energy difference between the metastable structures and the convex hull (energy above hull) (The figure is a log-log plot). The mean absolute error of PPF with respect to DFT was 0.0284 eV/atom.
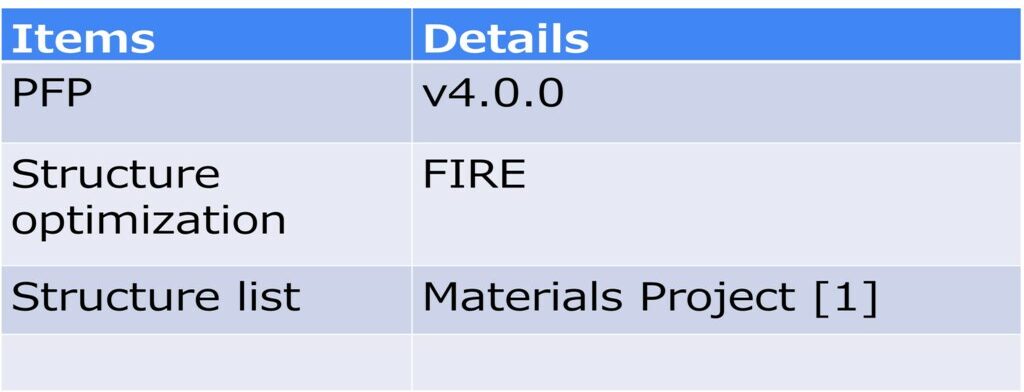
Simulation Conditions
References
[1] Materials Project. https://next-gen.materialsproject.org/Publication date of this case: 2024.03.26
-


 URL
URL
Copied
what's new
Direct derivation of atomic displacement parameters using NNP-MD
CeramicsMetals and Alloys
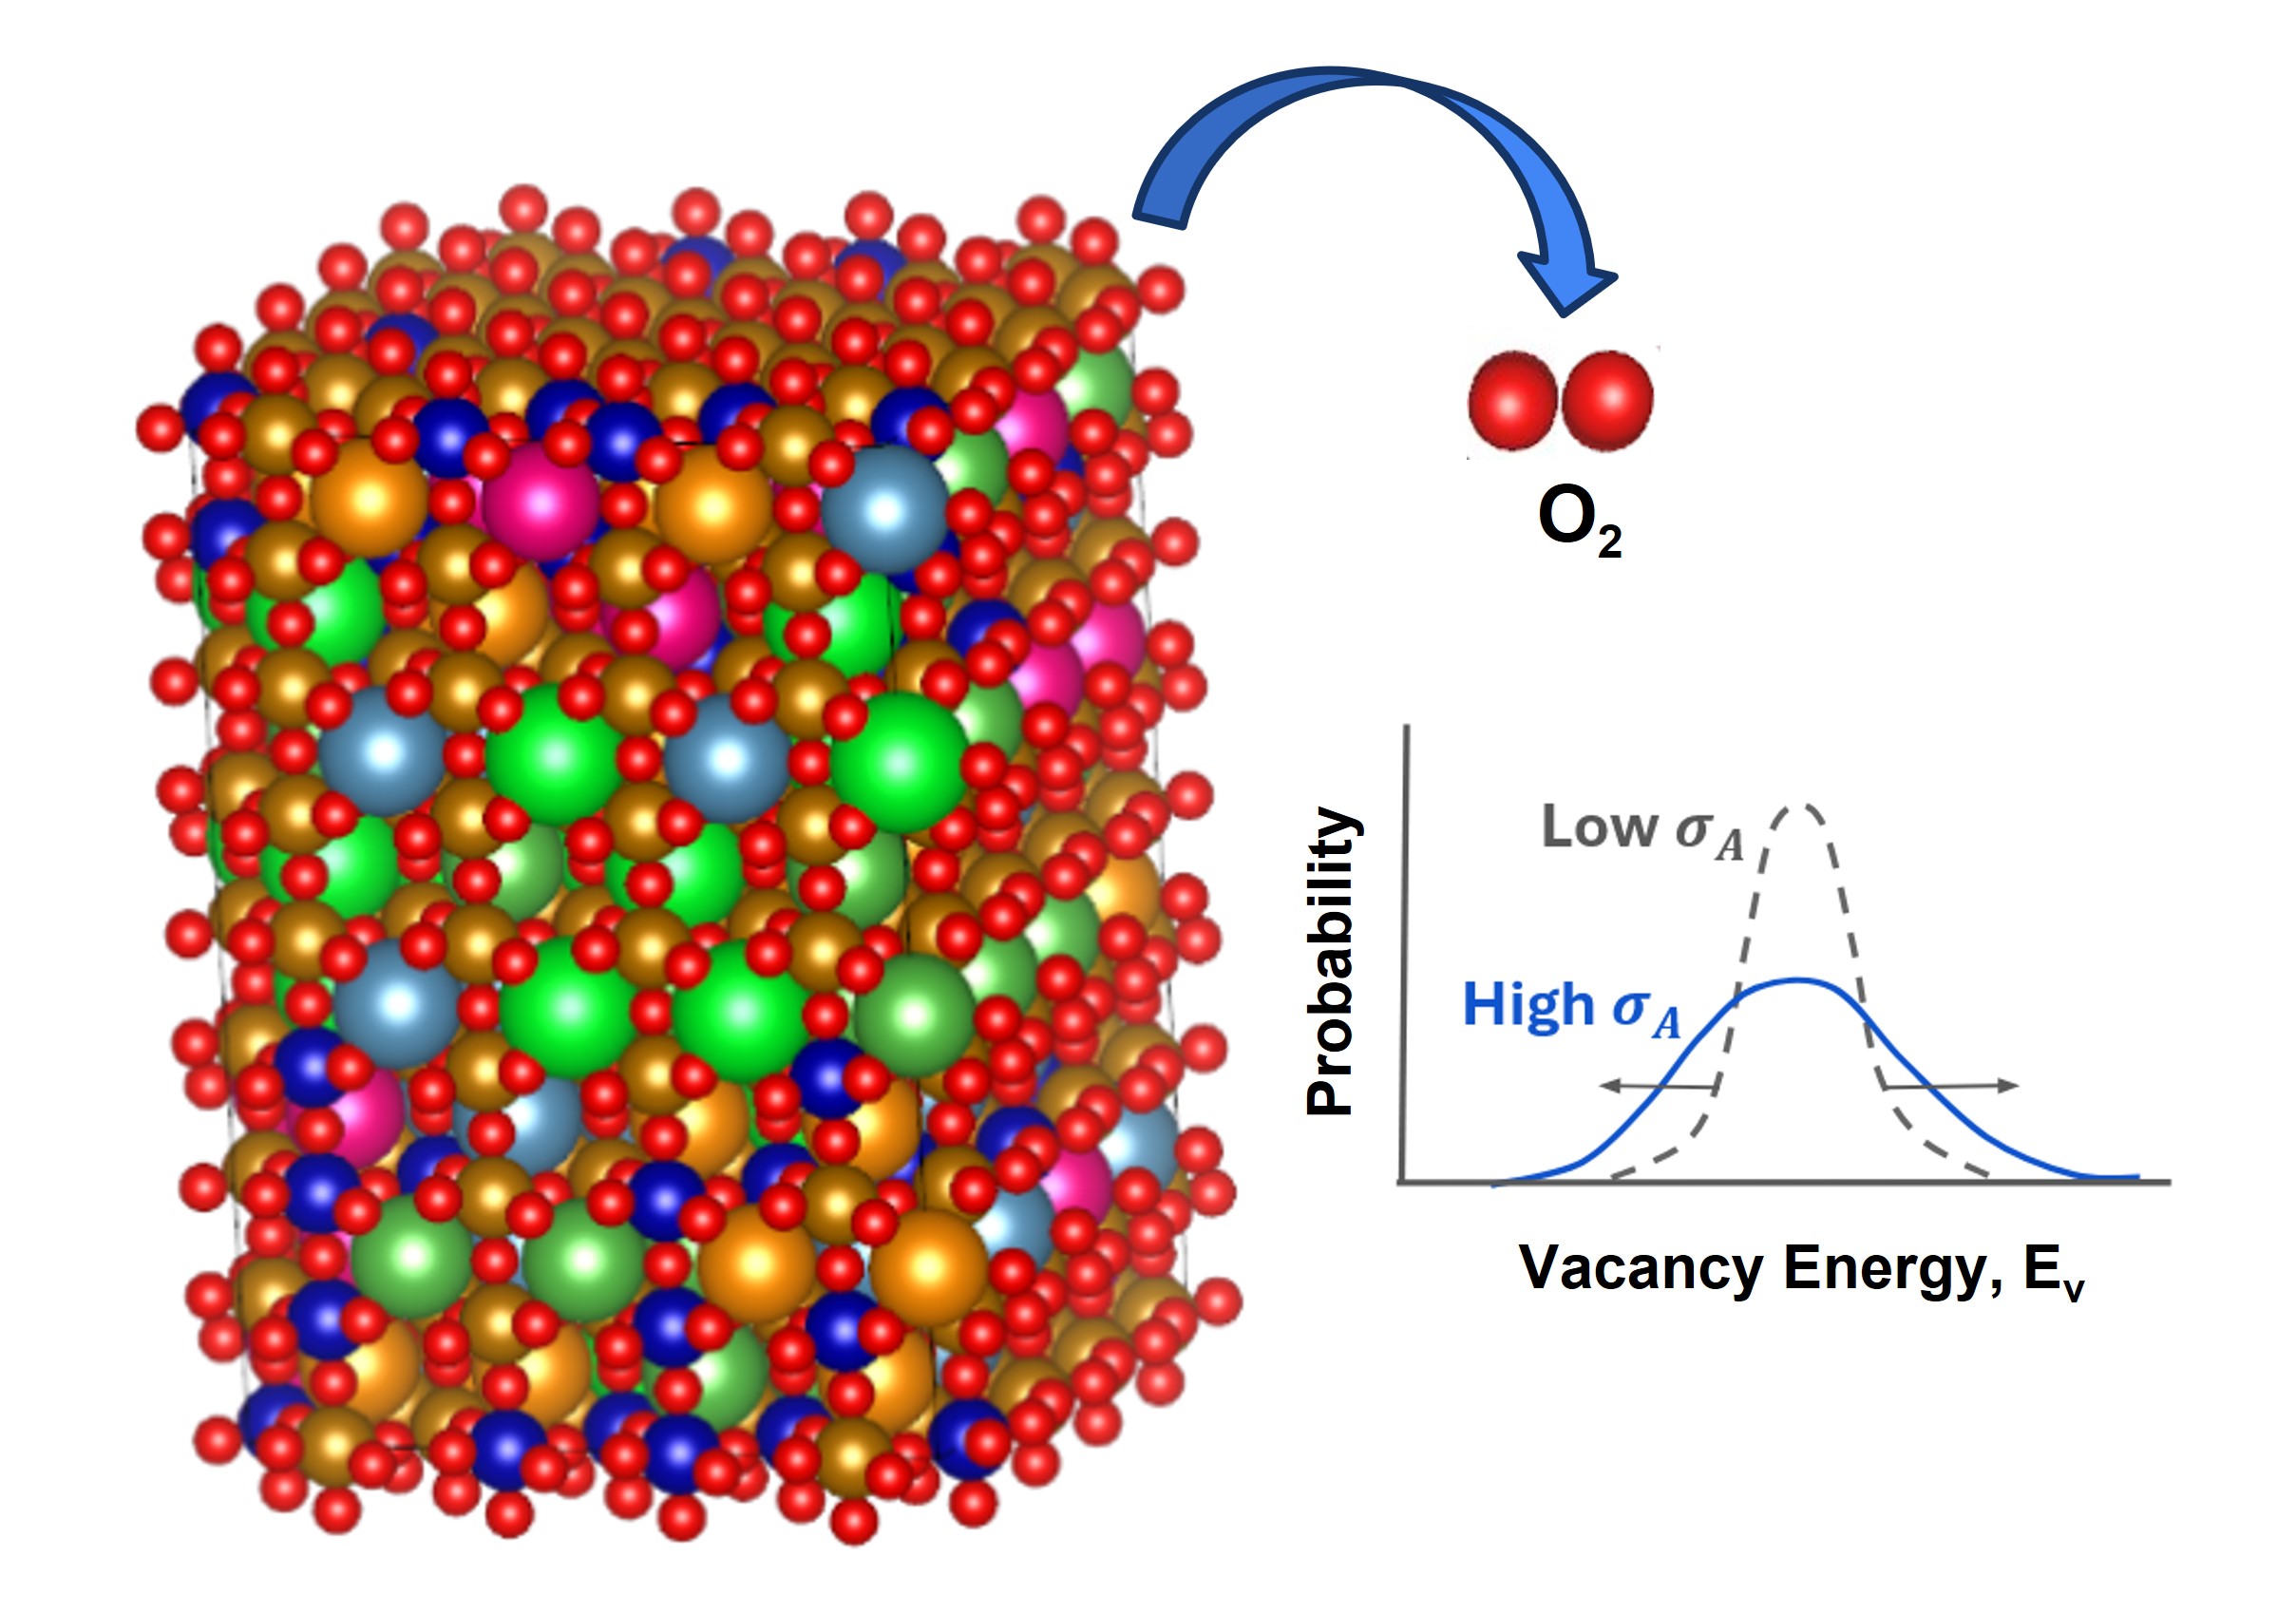
A Statistical Understanding of Oxygen Vacancies in High-Entropy Perovskite Oxides
CeramicsMetals and Alloys
SiO₂ Dry Etching Simulation Using LightPFP
CeramicsMetals and Alloys
Analysis of Surface Reaction Mechanism between ALD Precursor and Substrate
CeramicsMetals and Alloys
Catalyst Screening for Ammonia Synthesis Catalyst
CeramicsMetals and Alloys