Verification of Predicted Performance of PFP
Machine learning models, including MLIPs, are typically evaluated based on how accurately they can predict outcomes for data not included in the training set. Here, we present the performance evaluation results for PFP. In addition to assessing prediction accuracy for energies and forces, we also evaluated its ability to reproduce key materials properties.
PFP Energy and Force Prediction Performance Verification
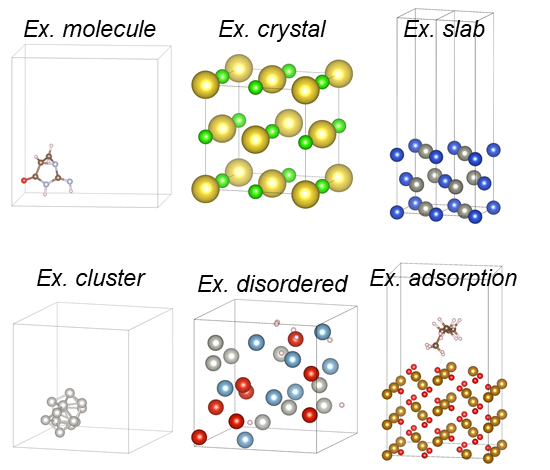
Aiming to be a universal MLIP, PFP has been trained on a vast number of atomic combinations across 96 elements, covering all those found in nature. The training dataset includes not only molecules and crystals but also a wide variety of structures and their associated energies—such as slabs, clusters, disordered systems, and adsorption configurations—as illustrated in Figure 1.
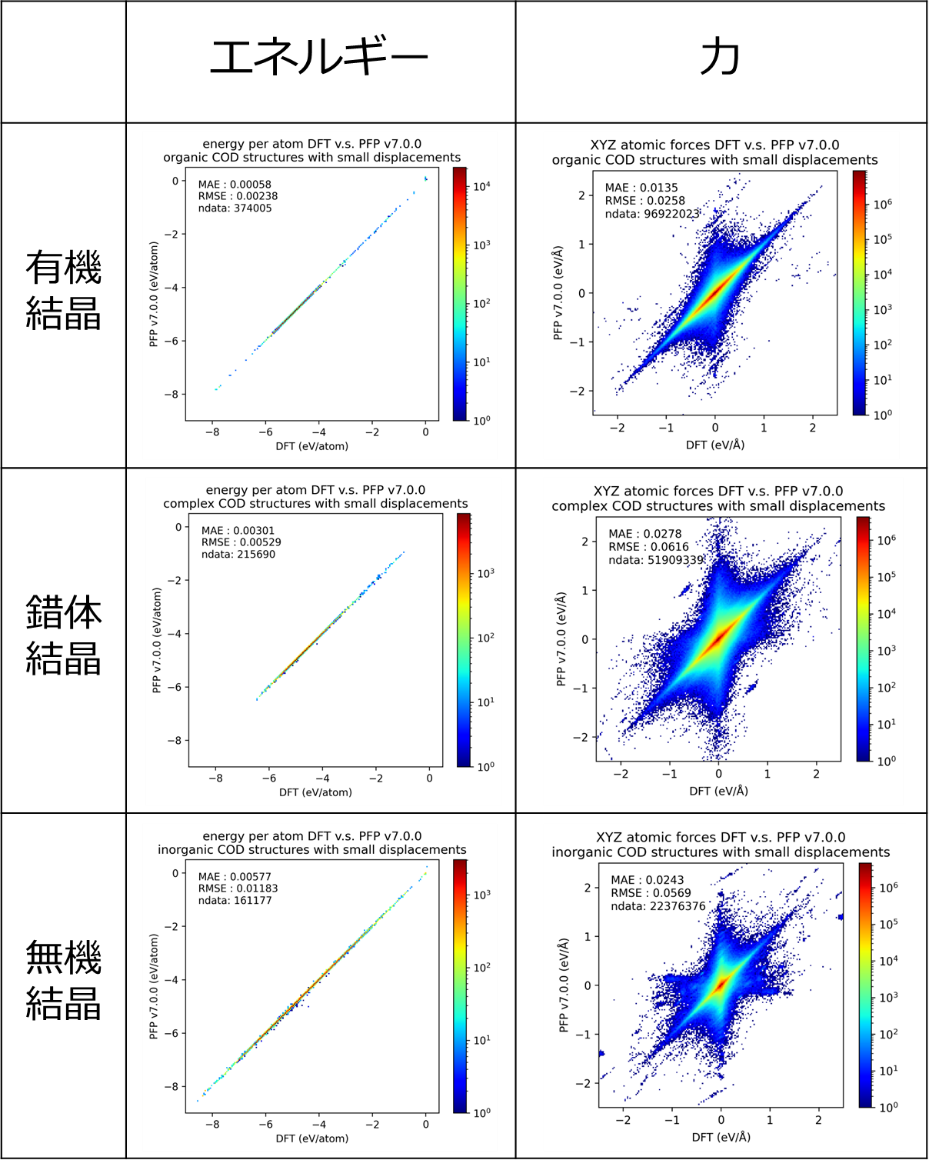
To evaluate how well PFP reproduces the properties of real-world materials, we conducted a performance benchmark using structures from the Crystallography Open Database (COD). Importantly, the benchmark dataset used in this evaluation was not included in PFP’s training data. Figure 2 shows the results for energy and force predictions. The color scale indicates data density: red represents high-density regions (more data points), while blue represents low-density regions. Calculations were performed on COD structures that were first geometry-optimized and then subjected to small atomic displacements. Energies are reported per atom, while force values are plotted as independent components (x, y, and z) for each atom. These results confirm that for a diverse range of solids—including organic, complex, and inorganic crystals—PFP accurately reproduces both the energies and forces calculated by DFT.
Verification of Material Properties by PFP
The density and phase diagram of a material are strongly influenced by interatomic interactions. Accurately reproducing these properties demonstrates the model's ability to capture atomic behavior while properly accounting for these interactions. In this section, we present validation results for the density of liquid organic compounds and the phase diagram of inorganic crystals.
Verifying the density of liquids
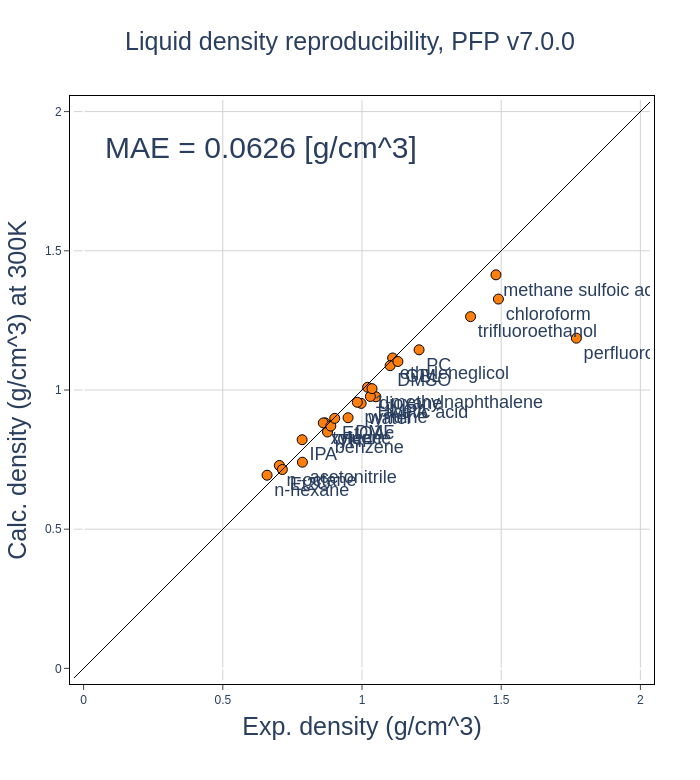
Figure 3 compares the experimental density values of 25 commonly studied organic compounds with those calculated using PFP. Points closer to the diagonal line indicate better agreement. The results show that PFP accurately reproduces the densities of most organic compounds.
Verification of the phase diagram
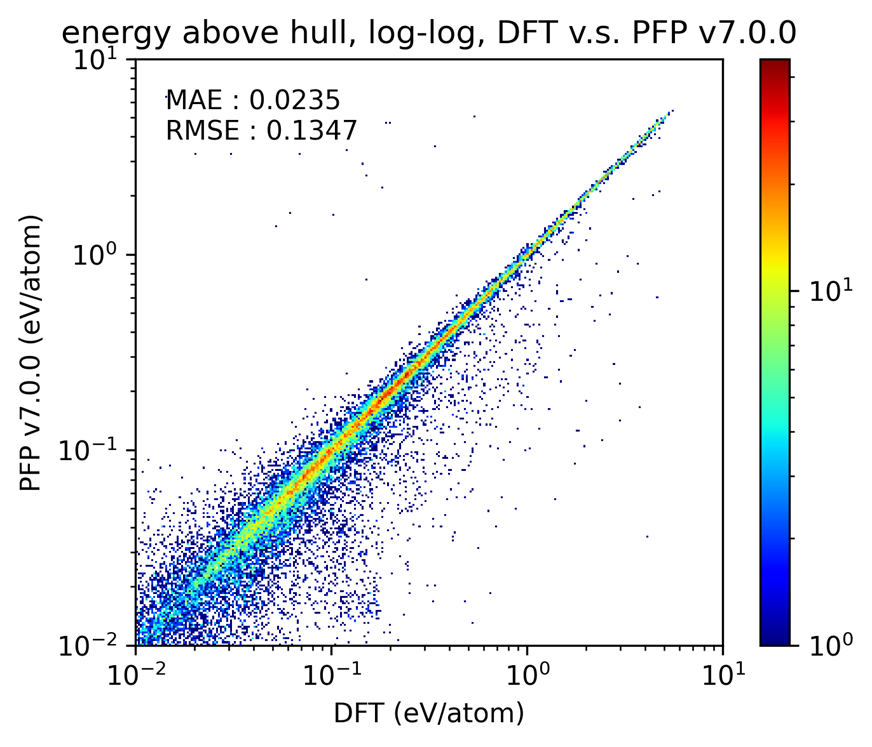
Next, we present the validation results for inorganic crystal phase diagrams. A phase diagram of inorganic crystals maps various crystal structures in a space defined by elemental composition and formation energy. As a measure of reproducibility, we focused on the prediction accuracy of the energy above hull for metastable structures—that is, structures other than the ground state—when constructing the phase diagram. This metric evaluates whether the convex hull is correctly drawn and whether relative energy differences between structures with similar compositions are accurately represented. The results are shown below. The data points are concentrated along the diagonal line, indicating a high level of agreement with the reference data.
-


 URL
URL
Copied